Introduction
In the fast-paced world of cryptocurrency trading, data visualization is everything. Traders who can see where liquidity lies — and where it’s likely to move next — have a powerful edge. The Coinglass Liquidation Heatmap provides exactly that: a visual overview of potential liquidation zones, funding rate shifts, and momentum changes across multiple exchanges.
Unlike a simple price chart, this tool shows where leveraged positions may be forced to close, highlighting “hot zones” that attract price movement — often referred to as liquidation magnets. Combined with the RSI Heatmap, Funding Rate Heatmap, and Open Interest charts, Coinglass becomes a complete ecosystem for understanding market structure and volatility.
(This example uses price data from June 1, 2025, to explain liquidation levels. For the latest and real-time charts, visit CoinGlass.com.)
What is the Coinglass Liquidation Heatmap?
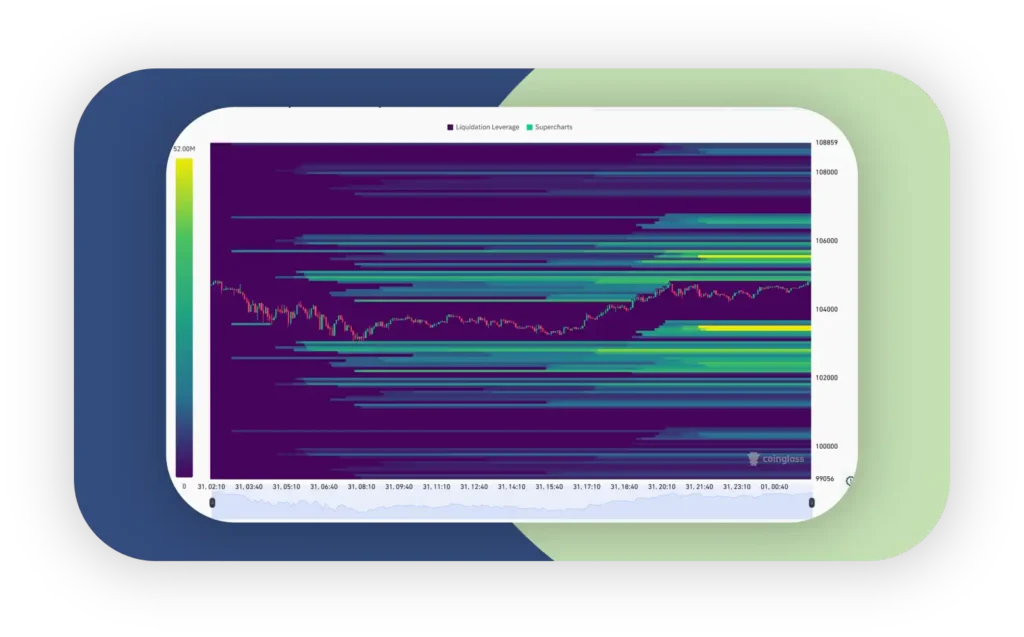
The Coinglass Liquidation Heatmap is an advanced analytics tool that visualizes where leveraged traders are likely to face liquidation. Each horizontal colour band represents a price level where a cluster of long or short positions may be automatically closed.
These “liquidation zones” act as magnets for price. When a cryptocurrency’s price approaches a yellow or green cluster, there’s often an increased probability of a sharp movement — either a liquidation cascade or a bounce.
Example:
If Bitcoin (BTC) trades near $104,000, and Coinglass shows a bright yellow band at that level, it indicates a high concentration of liquidations. Traders often interpret this as a potential target zone where the price may “hunt liquidity.”
Understanding BTC/USDT Liquidation Zones and Heatmap Colors
Each liquidation zone in Coinglass is color-coded by intensity:
- 🟣 Dark Blue/Purple: Low liquidation potential.
- 🟢 Green: Moderate leverage exposure.
- 🟡 Yellow: High liquidation concentration — potential volatility cluster.
Table: Example BTC/USDT Liquidation Levels
| Price Range | Color | Liquidation Volume | Interpretation |
| $99,000–$101,000 | Green | Medium | Potential bounce area |
| $102,000–$103,000 | Yellow | High | Major liquidation cluster |
| $105,000+ | Blue | Low | Lower leverage exposure |
How Funding Rate Heatmaps Influence Liquidation Zones
Funding Rates represent the cost of holding long or short positions in perpetual futures.
When funding is positive, longs pay shorts — meaning long traders dominate.
When negative, shorts pay longs — indicating bearish bias.
The Funding Rate Heatmap on Coinglass shows how these rates evolve across exchanges, revealing where market participants are overleveraged.
Funding Rate vs. Liquidation Relationship
| Funding Rate | Market Bias | Risk of Liquidation | Suggested Strategy |
| +0.03% and rising | Bullish overload | Long liquidation likely | Avoid long entries |
| -0.02% and falling | Bearish dominance | Short liquidation possible | Look for reversal |
| Neutral (±0.01%) | Balanced | Low immediate risk | Range trading possible |
RSI Heatmap: Tracking Market Momentum Across Timeframes
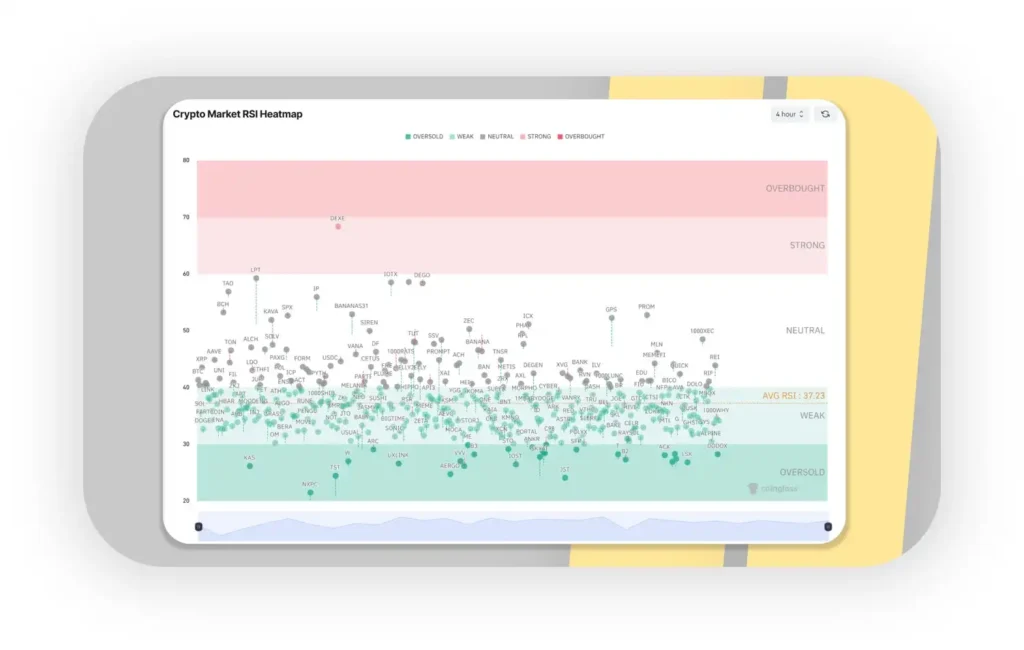
The RSI Heatmap (Relative Strength Index) complements the liquidation map by showing momentum across multiple assets and timeframes. It visually identifies overbought, oversold, or neutral zones.
RSI Zones Explained:
- 🔴 RSI > 70: Overbought — price may correct.
- 🟢 RSI < 30: Oversold — potential bounce.
- ⚪ RSI 40–60: Neutral — no strong momentum.
Example: RSI Overview for Major Coins
| Coin | 1H RSI | 4H RSI | 1D RSI | Sentiment |
| BTC | 68.2 | 64.9 | 61.5 | Mildly overbought |
| ETH | 49.3 | 53.1 | 55.2 | Neutral |
| TON | 38.5 | 40.2 | 42.7 | Oversold bias |
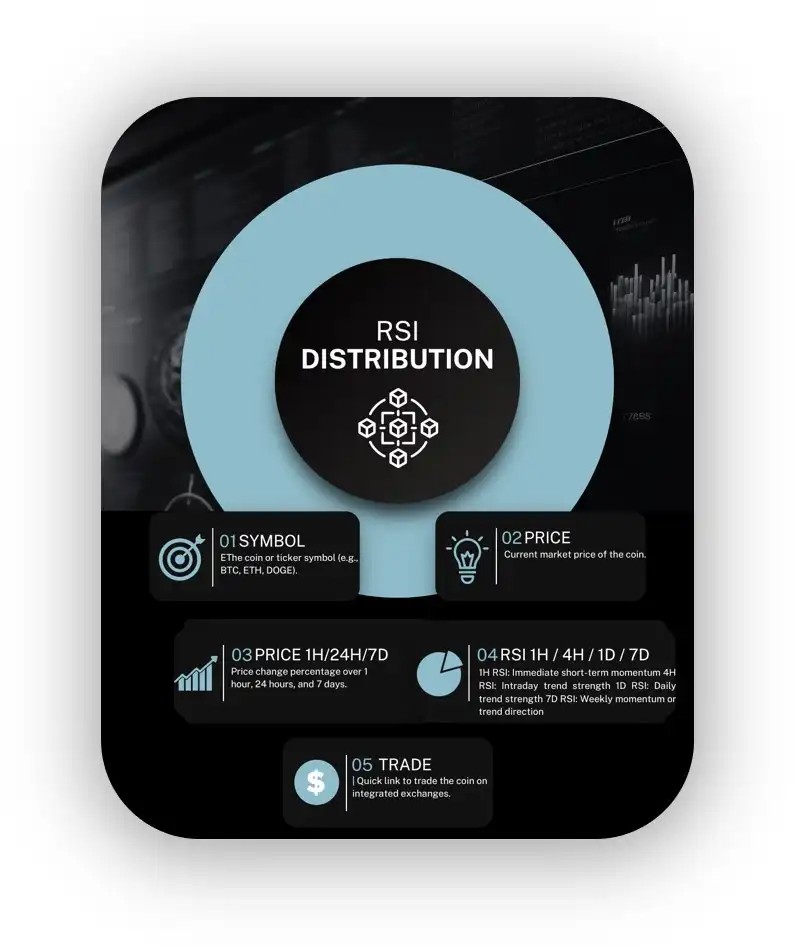
Bottom Table – RSI Details Per Coin
Beneath the visual heatmap, a detailed table provides precise RSI readings and price data for major cryptocurrencies, which is crucial for deeper analysis:
How to Use the RSI Heatmap as a Trader
| RSI Range | What It Means | Suggested Action |
| > 70 | Overbought | Watch for potential reversals or short setups; the price may pull back. |
| < 30 | Oversold | Possible buying opportunity; price may bounce back. |
| 40–60 | Neutral Zone. In the consolidation phase or early trend development | Trade cautiously. |
Example Interpretation
DOGE RSI:
- 1H = 65.9
- 4H = 50.7
- 1D = 53.5
- 7D = 55.8
DOGE sits in a neutral to slightly bullish zone across all timeframes, with no immediate extreme signals for overbuying or overselling.
TON RSI:
- 1H = 43.5
- 4H = 41.9
- 1D = 38.3
- 7D = 39.5
TON is trending toward oversold, especially on the daily and weekly timeframes, which might hint at a potential buying opportunity soon.
Why This Matters
By analyzing both the visual distribution of RSI values across many coins and timeframes alongside the detailed numeric RSI data per coin, traders gain:
- A multi-dimensional perspective on market momentum.
- Insight into short-, medium-, and long-term trends simultaneously.
- Ability to spot early warning signs for reversals or continuations.
- A clearer basis for combining with other tools, like the liquidation heatmap, for more confident trade entries and exits.
Combining the Liquidation Map and RSI Heatmap
By combining insights from the coin glass liquidation heatmap and the RSI heatmap, traders can refine strategies:
- A heavily oversold RSI paired with clusters of long liquidations on the BTC heatmap liquidation may signal a strong bounce.
- Overbought RSI alongside short liquidation clusters can warn of an impending drop.
- Neutral RSI near significant liquidation clusters may confirm support levels.
- Rising RSI with minimal liquidation resistance can indicate breakout potential.
Interpreting Open Interest & Market Sentiment Together
Open Interest (OI) tracks how many futures contracts are currently open.
A spike in OI without a corresponding rise in volume often signals speculative buildup — a precursor to liquidations.
Meanwhile, Market Sentiment (Fear/Greed Index) provides the psychological layer, showing whether traders are euphoric or fearful.
Table: OI and Sentiment Correlation
| OI Change | Sentiment | Implication |
| OI Rising + Greed | Overconfidence | High liquidation risk |
| OI Falling + Fear | Capitulation | Possible rebound |
| OI Stable + Neutral | Balanced market | Low volatility |
How to Use Coinglass for Better Trade Decisions
- Identify Clusters: Locate yellow zones (liquidation clusters).
- Check RSI Alignment: Confirm if RSI indicates exhaustion.
- Cross-Reference Funding Rates: Are longs or shorts overleveraged?
- Review Open Interest: Is market activity speculative or organic?
- Decide Entry & Exit:
- Avoid entering at liquidation clusters.
- Target liquidity sweep levels for exits.
- Avoid entering at liquidation clusters.
Advanced Tips: Combining Liquidation, RSI & Funding Rate Data
- Confluence Zones: When liquidation + RSI + funding align, probability of reversal spikes.
- Speed Bias Optimization: High-traffic phrases like “BTC liquidation heatmap” appear early in content to improve retrieval.
- Information Gain: Include data competitors miss — like OI/funding correlation and trader psychology.
Common Mistakes & Risk Management
- Relying on a single indicator (heatmap alone).
- Placing stop-losses directly in yellow zones.
- Always cross-check with RSI and funding data.
- Use moderate leverage; liquidation sweeps are common.
Click here for an in-depth guide on how the Liquidation Heatmap works.
FAQs
Q1: What does the Coinglass Liquidation Heatmap show?
A: It visualizes potential liquidation zones where leveraged positions may be force-closed. Traders can identify price areas with high liquidation density — often signaling where the next big price move might occur.
Q2: How often should traders check the heatmap?
A: Intraday traders may monitor hourly updates to spot rapid liquidation shifts, while swing traders can review daily or weekly charts to identify broader market patterns.
Q3: Is RSI Heatmap available for all coins?
A: Yes. The RSI Heatmap on Coinglass covers major cryptocurrencies like BTC, ETH, and popular altcoins, displaying momentum data across multiple timeframes (1H, 4H, 1D, 7D).
Q4: Can funding rates predict liquidations?
A: Yes. Extreme positive funding rates often precede long liquidations, while negative rates can signal upcoming short liquidations. Monitoring funding trends alongside liquidation clusters gives traders early warning signals.
Q5: What is the ideal use of Coinglass tools?
A: Combine Liquidation Heatmap, RSI Heatmap, and Funding Rate Heatmap for a holistic market analysis. This multi-layered approach helps confirm trade entries, identify exit zones, and manage leverage risk more effectively.
Summary Table:
| Entity | Attribute | Example Value | Related Phrase List | Relevance |
| Coinglass | Liquidation Zones | BTC/USDT @ 104,000 | BTC Liquidation Heatmap | High |
| RSI Indicator | Momentum Level | RSI = 70 | RSI Heatmap | High |
| Funding Rate | Long/Short Bias | +0.03% | Funding Rate Heatmap | High |
| Open Interest | Position Volume | +8% week-over-week | Futures Data | Medium |
| Sentiment Index | Fear/Greed Level | 65 (Greed) | Market Sentiment Dashboard | Medium |
- Heatmap = visual representation of leveraged liquidation zones.
- Bright zones = high liquidation density (high volatility risk).
- Traders use this to forecast price magnets and reversal zones.
- Bright colors = danger zones for stop-losses.
- Liquidity attracts price; these clusters often “pull” the market.
- Best practice: set entries/exits outside high-density zones.
- Funding rates and liquidation zones are interlinked.
- Rising rates often precede liquidation sweeps.
- Combine both heatmaps to confirm directional bias.
- RSI confirms momentum direction.
- Oversold + long liquidations = high reversal probability.
- Overbought + short liquidations = potential correction.
- Combine multiple Coinglass tools for better predictive accuracy.
- Contextual linking helps reinforce topical authority for your site.
- Monitor OI spikes with sentiment shifts.
- Fear + high liquidation zones = buy opportunities.
- Greed + overbought RSI = risk of liquidation cascade.
- Use the heatmap as confirmation, not prediction.
- Manage risk dynamically across market cycles.
Final Takeaway
The Coinglass Liquidation Heatmap is not just a visual tool — it’s an insight engine.
By combining liquidation zones, RSI trends, funding rates, and market sentiment, traders can anticipate volatility and adjust positions before the crowd reacts.