A liquidation heat map is a visual representation to identify and track where large liquidation levels exist in the market for various assets, such as cryptocurrencies.
It provides knowledge of the levels where traders’ leveraged positions might be forced to close, resulting in significant market movements such as trend reversal shifts, resistance, or support.
If you are having trouble understanding the liquidation heat map, We encourage you to read this blog post in its entirety.
By doing so, you’ll gain a thorough understanding of the liquidation heat map and learn how to use it effectively to become a profitable trader and make informed decisions. Here’s a detailed explanation of how to understand and utilize a liquidation heat map.
Table of Contents
To understand the liquidation heat map you need to understand the following, we are going to use the site known as coinglass.com
What is Liquidation?
In futures or margin trading whenever a trader opens the positions they use leverage, which means they borrow funds from the exchange to increase their position size in the market,
For example, suppose a future trader has $1000 in his account and uses 20x leverage means he borrowed $19000 from the exchange to increase his position size up to $20000, so now the trader can control $20000 worth of an asset.
For a bigger position size, there comes a bigger risk. After opening a leveraged position, the trading platform assigns a liquidation level.
If the price reaches that specific level the trader’s position will be automatically closed (liquidated: which means their funds will be zero) by the exchange to prevent further losses.
The liquidation level is set according to the leverage used by traders and the original balance of the traders. So if the trader took the higher leverage, the liquidation level would be close to the entry price of the position.
Understanding Liquidation Levels
For example, a futures trader Suppose a trader has $20 and opens a long position on a coin worth $1 and takes leverage of 10x, Enabling the trader to buy 200 coins worth $200.
Now, if the trader has opened a long position, expect a price increase. If the price of this coin increases from $1 to $1.1, then he has a profit of 20 dollars,
But If the price decreases to $0.95, he is in a loss of $10, which is his original account balance without leverage,
The exchange will set the liquidation price at $0.90 to ensure that the trader does not lose more funds than their original account balance. $0.90 is his Liquidation Level.
We know from the above example, we understand that liquidation levels are specific points where the trader’s funds become zero. Simply put isnt it?,
Difference Between Liquidation and Liquidity
Let us now remove the confusion between liquidation and liquidity. In simple terms, liquidity refers to the ease of buying and selling,
which means how easily one can buy or sell any specific asset. For example, during COVID-19 in the automotive industry,
Every manufacturer wanted to sell their car but there were no buyers, which means there was no liquidity in the automotive industry.
Whereas liquidation is the process where a trader’s funds become zero when the price reaches a particular level, that particular level is known as the liquidation level.
Identifying Liquidation Levels
Now that we understand the liquidation, liquidation levels, and the difference between liquidity and liquidation, let’s go to the chart from coinglass.com and see how we can identify liquidation levels.
How to read a Liquidation Heat Map using a Coinglass liquidation heatmap?
We can get this heat map from the website CoinGlass.com, Following is the interface of a page from coinglass.com.
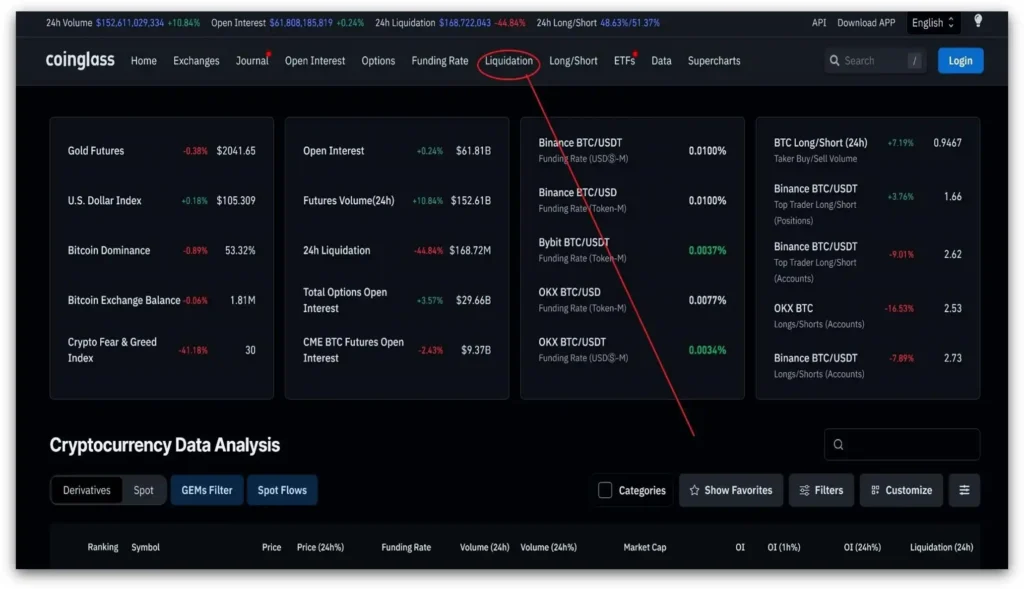
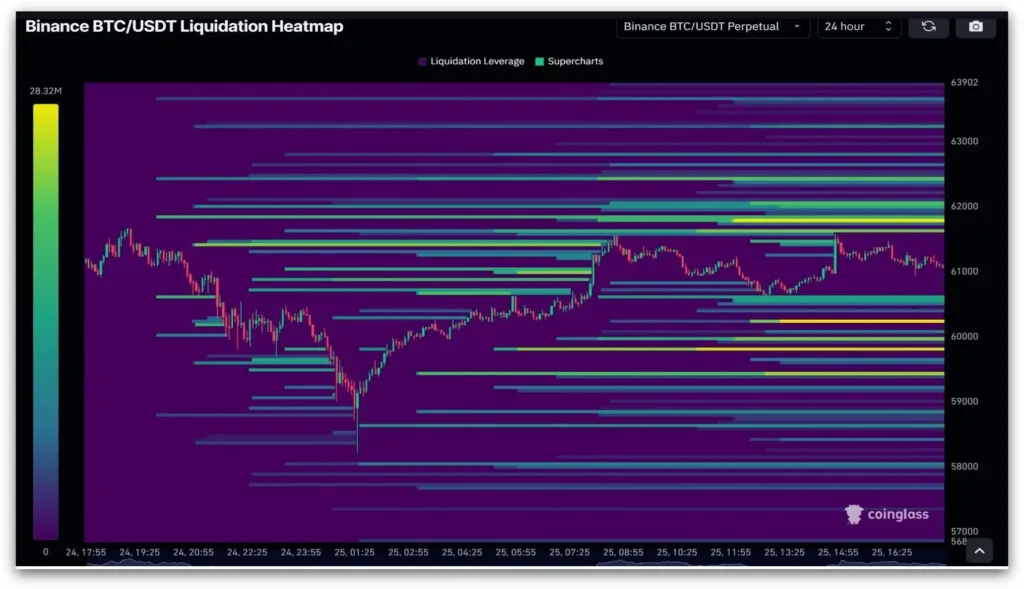
Go to the liquidation section, then the third option, “Liquidation Heatmap.” Clicking on it will open an interface showing the perpetual contract of Bitcoin USDT (bitcoin liquidation heatmap).
Analyzing Liquidation Levels from the Bitcoin Liquidation Heatmap
We can input any coin or token’s name here. We’ll analyze Ethereum for the sake of an example.
The interface shows the perpetual contract of Ethereum and its exchanges which in this case is Binance on the left. The time frame option from 12 hours to one year is on the left.
The picture below shows you the important liquidation levels in a 12-hour timeframe. For short-term trades, we will look at shorter timeframes to check where are the liquidation levels.
Note that the price often moves to grab liquidation closing traders’ positions, this is one of the most common ways exchanges make money.
Now, we’ll show you the seaborn heatmap which is the liquidation heatmap for Ethereum in a 12-hour timeframe.
On the chart, the lines represent liquidation levels, and the scale at the left shows colors representing the amount of liquidation.
The brighter the color like yellow, the higher the liquidation, while dull colors like purple and violet represent lower liquidation.
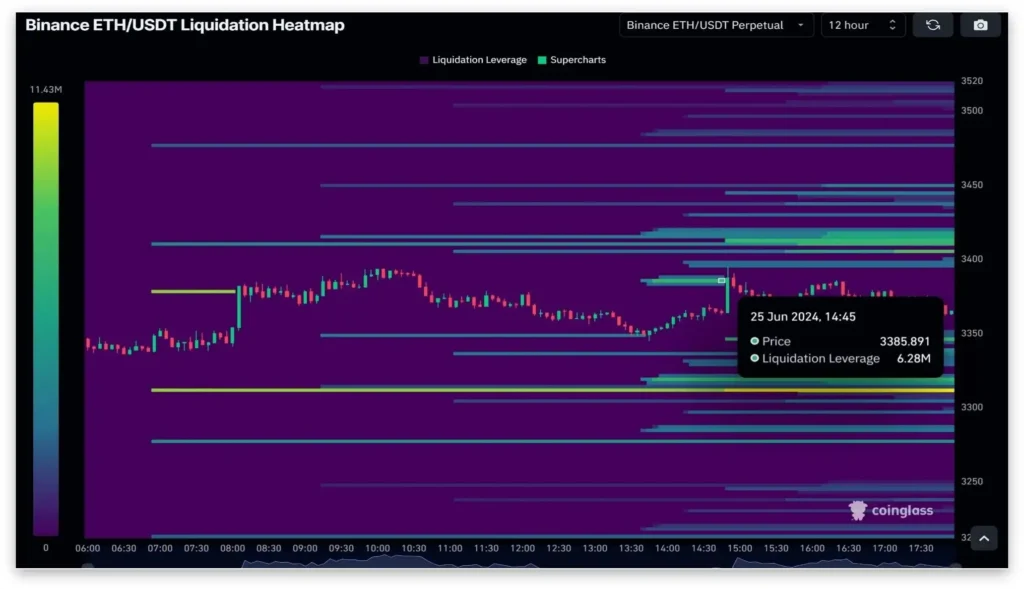
Ethereum on June 24,2024 was around $3360. There was a significant liquidation level at $3385. Ethereum reached that level of $3385 on 25 June 25,2024 grabbed liquidity and got back into the range, liquidating arround $6 million.
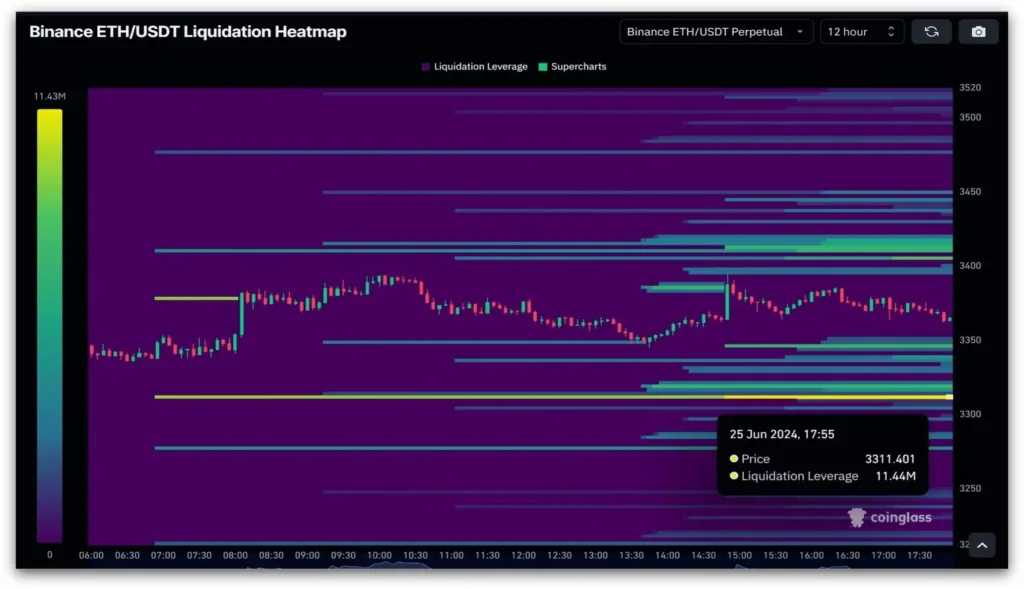
On the downside, the $3311(level i-e bright yellow) has about $11 million in liquidation. If the market reaches that level, accounts worth $11 million will be liquidated.
On second thought Ethereum might grab the $11 million liquidity and then come back to its range creating a fakeout, It can only happen when Bitcoin does not break its support.
Similarly, you can analyze the Bitcoin exchange liquidation map by following the same steps mentioned above.
Understanding the Purpose of the Liquidation Heatmap:
Having grasped the concept of heat maps, it’s easy to understand their purpose and how they’re used. An sns heatmap exposes areas with high levels of liquidity in the market.
These areas indicate the concentration of large buy or sell orders, represented by color gradients where brighter colors signify higher liquidity.
Identifying Key Levels: liquidation heat maps are used to identify important levels where markets could be volatile, such as levels where large orders or potential price reversals, are likely to occur.
Helping in making informed decisions to position buy and sell orders more strategically.
Predicting Market Trend: Liquidation heat maps help in predicting market movements. Prices usually move towards high liquidity areas to fill large orders, hunt stop loss, or liquidate funds.
The liquidation heat map provides a clear understanding of these zones that help traders predict short-term market trends.
Managing Risk: Traders can better manage risk by knowing high liquidity levels.
It helps traders visualize the bigger picture of the market making them understand the price movements which results in taking positions according to these zones providing more stability hence reducing the chances of loss.
Best Practices: For effective and efficient decision-making:
- Daily Observation: Keep yourself updated by continuously monitoring liquidation heat maps with market changes, especially during times of high volatility in the market.
- Confluence: Use liquidity heat maps alongside other analysis methods to validate trading strategies.
- Understanding Market Perspective: Fundamentals also play a vital role in helping visualize the bigger market context, Fundamentals are news events such as FOMC, CPI index, etc, and macroeconomic factors such as War, Pandemic, etc which can affect liquidity zones. Sometimes the market just breaks the high liquidation zone and continues its trend in the same direction because of high volume in the market due to bullish news or bearish news.
Alternate websites for Liquidation heatmap: HighBlockCapital and TradingLite also provide the liquidation heat map but with a paid subscription.
You can also get an idea of this liquidation map with glassnode liquidations heatmap.
However, Purchasing a premium subscription is not recommended for beginners, because they can access information needed for free on CoinGlass.com
Conclusion:
A liquidity heatmap is an effective tool for a user, providing information about the market structure and possible market trends.
Traders can deduce efficient strategies, manage risk better, and become more profitable by understanding and utilizing these maps in their analysis.
Applying the information from the liquidation heatmap with the technical and fundamental analysis in the market predicts price movements to these levels for grabbing liquidity.
The market is always in one of three phases that are: Continuation, Ranging, and Liquidation.
First is the continuation(i-e trending) after continuation there comes a Ranging i.e., the market stays in a specific price range, and after the Ranging, there comes a liquidation i-e Market grabs the liquidity before deciding to go in any direction for continuation.
Disclaimer! Integrate with Technical Analysis: The liquidity heat map is a tool that helps to predict the possible direction of the trend but here comes a disclaimer! Please do not trade solely based on liquidation levels, consider other confluences like technical analysis, price action, and fundamental analysis.
Combining all three with these liquidation levels, you can predict the next market move and make an informed decision.
For instance, aligning heat map data with support and resistance levels, trend lines, or indicators can give a more comprehensive market view.
Thank you for reading our blog post. We hope you found it both informative and engaging. We would love to hear your thoughts and feedback!
If you have any insights or experiences to share, please leave a comment below. Your response is greatly appreciated.
Summary
- Liquidation Map: The liquidation heatmap is a visual tool which highlights the large levels of liquidation in the cryptomarket.
This helps traders to see where it’s most likely that forced closings will occur. - Market signals
These maps indicate possible trend reversals and resistance zones.
It gives traders an insight into where the market could turn volatile. - What Is Liquidation
When leveraged positions are closed by the exchange,
It occurs when the trader’s funds have been exhausted. - Leverage Impact: Higher leverage means higher risk, as even minor price changes can wipe out money.
- What is the difference between liquidity and liquidation?
The term “liquidity” refers to how quickly an asset is bought or sold on the market.
A trader’s account becomes zero when the price is set. - CoinGlass heat maps
CoinGlass provides free liquidation temperature maps for Bitcoin and Ethereum.
Users can compare liquidation zones in multiple timeframes. - Heatmap Colours
Brighter colors, such as yellow, represent higher liquidation levels.
The darker colors, such as purple, indicate smaller liquidation amounts. - Ethereum Exemple
By June 2024, Ethereum was liquidated for $6M at $3385, while $11M were liquidated at $3311.
The graph shows the market’s movement towards these levels and then reversing. - Heatmaps: What are they for?
These heatmaps help traders plan their entries, exits and stop losses more strategically. - Best Practices
Monitor the liquidation heat map daily, particularly during times of high volatility.
Combine them with technical analyses, fundamentals and price action. - Alternative Tools
Paid platforms such as HighBlockCapital, TradingLite and Glassnode offer similar features.
Glassnode is best for free users. - Conclusion
Heat maps of liquidation give traders an in-depth view of the market structure.
They should, however, be used alongside other analysis methods and not by themselves.
FAQs
What is a liquidation heat map?
A liquidation heat map visually represents where large liquidation levels exist in the market for various assets, indicating potential significant market movements.
How does a coinglass liquidation heatmap help traders?
It helps identify areas where leveraged positions might be liquidated, indicating potential trend reversals, resistance, or support levels in the market.
What is liquidation in trading?
Liquidation occurs when a trader’s position is automatically closed by the exchange because the price has reached a level where the trader’s funds are depleted.
How do I find the liquidation heatmap?
You can find the liquidation heat map on websites like CoinGlass.com. Navigate to the liquidation section and select “Liquidation Heatmap” to view it.
What is the difference between liquidity and liquidation?
Liquidity refers to how easily an asset can be bought or sold, while liquidation is the process of closing a trader’s position when their funds are exhausted.
How can I identify liquidation levels on a heat map?
Liquidation levels are shown as lines on the chart with colors indicating the amount of liquidation. Brighter colors represent higher liquidation levels.
Are there alternative websites for liquidation heat maps?
Yes, alternatives like HighBlockCapital and TradingLite offer liquidation heat maps, though they may require a paid subscription. CoinGlass.com offers free access.
How should I use the liquidation heat map for trading?
Use it alongside other analysis methods to identify key market levels and manage risk. It helps in predicting short-term market trends and setting buy/sell orders.
In it something is and it is excellent idea. It is ready to support you.
Spot on with this write-up, I seriously believe that this website needs ffar more attention. I’ll probably be
returning to read through more, thanks for the information!